Topic: Chart Card doesnt show the graph on custom data
Anuj Kumar
asked 5 years ago
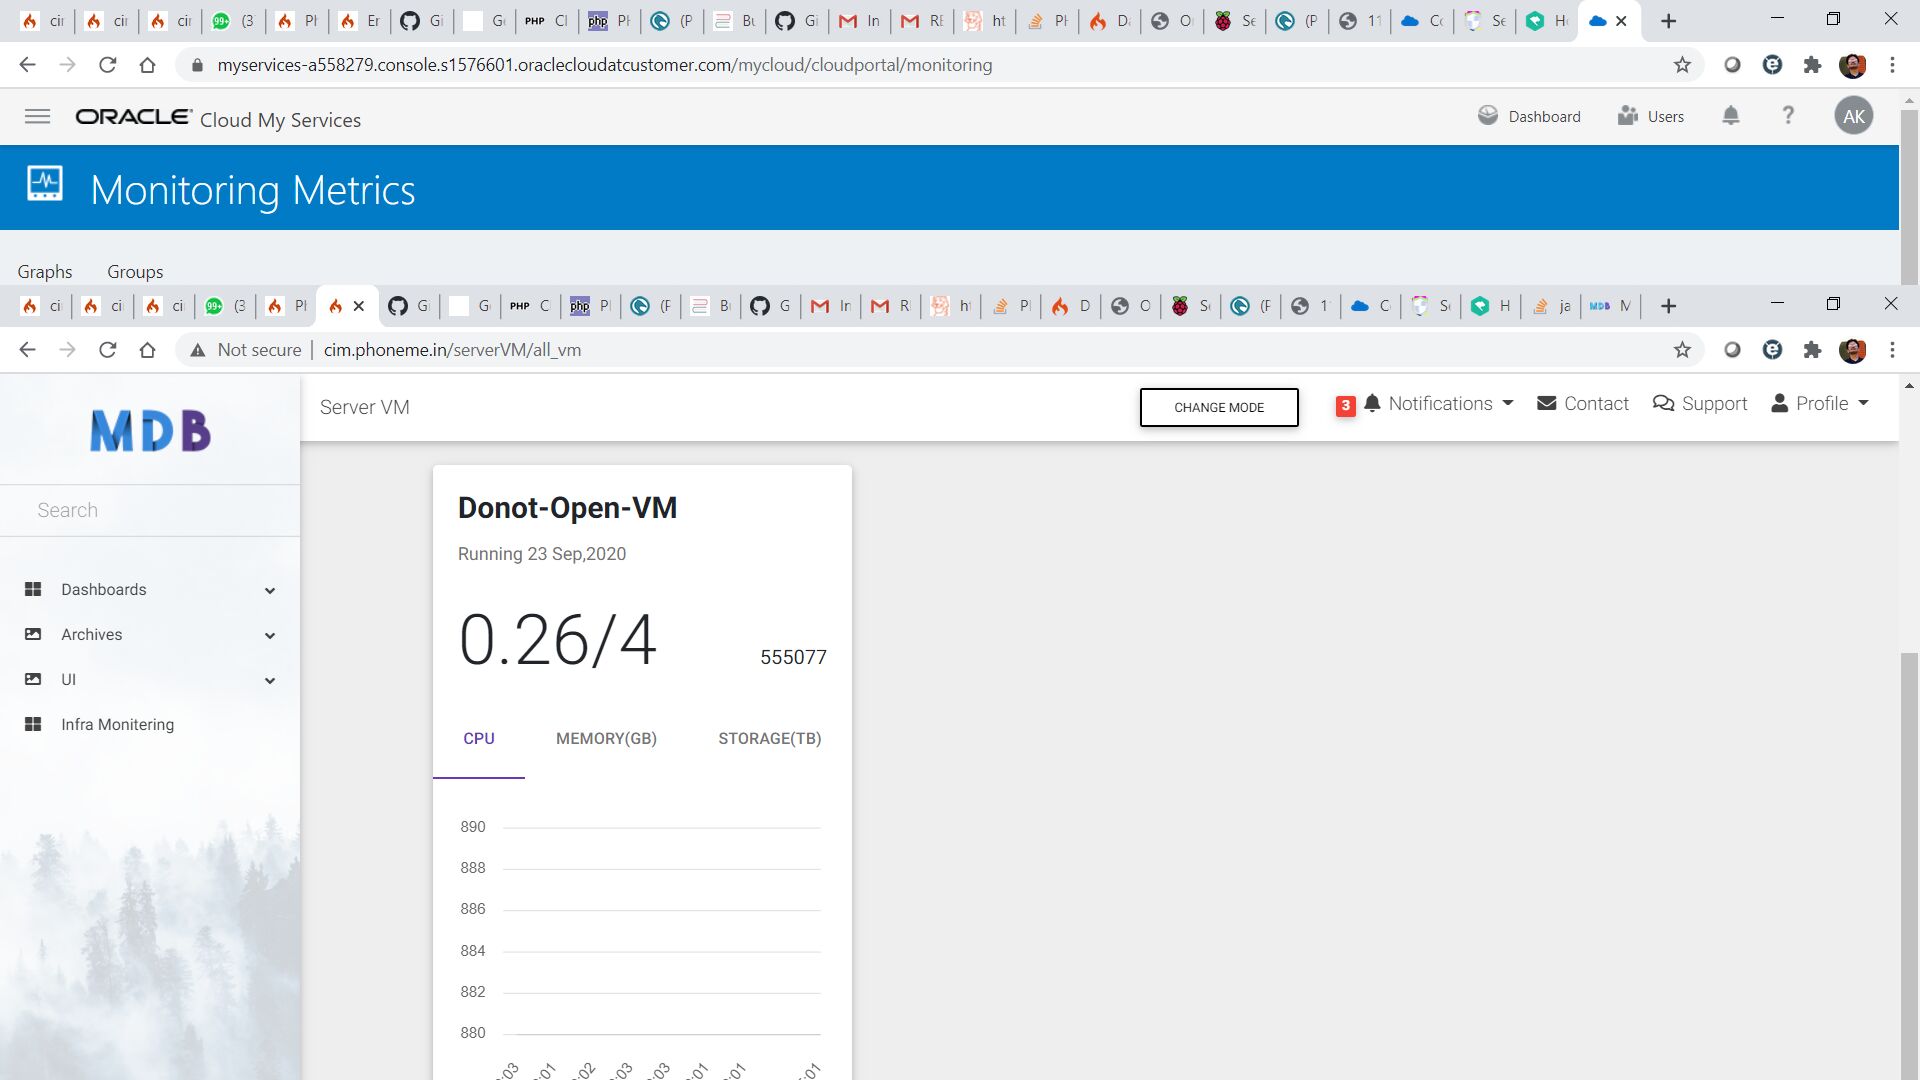
We are using the Chart-card component and exactly copied the code from the example . It works fine for the values supplied in the example but doesnt work with custom values in Y axis .
/****** Sample Code ****************************/
CPU Memory(GB) Storage(TB) -cpu-lineChart" height="250px"> -mem-lineChart" height="250px"> -storage-lineChart" height="250px">function createLineChart(divid,dataX,dataY) { console.log(dataY); var ctxL = document.getElementById(divid).getContext('2d'); var myLineChart = new Chart(ctxL, { type: 'line', data: { labels: dataX, datasets: [ { fill: false, borderColor: "#673ab7", pointBackgroundColor: "#673ab7", data: dataY } ] }, options: { responsive: false, legend: { display: false }, elements: { line: { tension: 0.0 } }, scales: { xAxes: [{ gridLines: { display: false, }, ticks: { padding: 15, height: 30 } }], yAxes: [{ gridLines: { drawBorder: false }, ticks: { maxTicksLimit: 5, padding: 15, min: 880, max: 890 } }] } } }); } // Line //var dataX=; //var dataY=; //alert(dataX); var dataX=strX.split(","); var datacpu=strCPU.split(",").map(x=>+x); var datamem=strMEM.split(",").map(x=>+x); var datastorage=strSTO.split(",").map(x=>+x); //var dataX=["8 AM", "10 AM", "12 PM", "2 PM", "4 PM", "6 PM", "8 PM"]; var dataY=[1,2,3,4,5,6,7,8,9,10]; createLineChart("-cpu-lineChart",dataX,dataY); createLineChart("-mem-lineChart",dataX,datamem); //createLineChart("-storage-lineChart",dataX,datastorage);

FREE CONSULTATION
Hire our experts to build a dedicated project. We'll analyze your business requirements, for free.
Status
Open
Specification of the issue
- User: Free
- Premium support: No
- Technology: MDB jQuery
- MDB Version: 4.19.1
- Device: Web
- Browser: chrome
- OS: Centos
- Provided sample code: No
- Provided link: No
Related topics
Tomek Makowski staff commented 5 years ago
Hi
Could you show me your code in the snippet code editor?
Snippet code editor: https://mdbootstrap.com/snippets/
Regards