Topic: Change properties of Minimalist charts
In MDB Angular, there is 'Minimalist charts' which I think apply from 'easy-pie-chart'.
My question is how can I change some properties of 'easy-pie-chart' such as 'lineWidth'.
I try
mdb-simple-chart [percent]="56" [barColor]="'4CAF50'" [lineWidth]="'16'"
or
[lineWidth]="16"
but it does not work.
Is there any way to change those remaining properties besides 'percent' and 'barColor' ?
Thank you.
apichai52
pro answered 8 years ago
Damian Gemza staff commented 8 years ago
Dear apichai52, We've already added support for every options to configure simple charts. It will be available in next release of MDB Angular Pro. But now you can access it from our GIT, which is available on branch #dev of MDB PRO repository. Best Regards, Damian
Jakub Strebeyko
staff answered 8 years ago
Hi there apichai52,
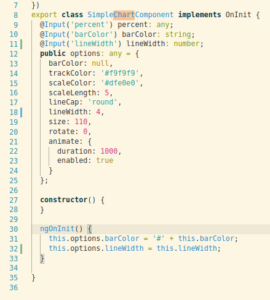
Yes. Currently, to have access of these chart-editing goodies, you have to edit the component's file, available at
mdb-angular-pro/src/app/typescripts/pro/easy-charts/chart-simple.component.ts
There, you can choose to either:
a) simply change lineWidth for all the minimalist charts in general using options object property, or
b) make the property open for customization within each instance by adding 2 appropriate lines of code for each option you're interested in - one in @Input and ngOnInit(). I'm attaching a screencap of how to do it for lineWidth.
With Best Regards,
Kuba
FREE CONSULTATION
Hire our experts to build a dedicated project. We'll analyze your business requirements, for free.
Resolved
- User: Pro
- Premium support: No
- Technology: MDB Angular
- MDB Version: -
- Device: -
- Browser: -
- OS: -
- Provided sample code: No
- Provided link: No
